Appendices
Appendix A: Overview of Case Study Variables
| . | Variable | Description | Type |
|---|---|---|---|
| 1 | REGION | Region | HH |
| 2 | DIST | District | HH |
| 3 | URBRUR | Area of residence | HH |
| 4 | WGTHH | Individual weighting coefficient (country-specific weighting co-efficient to derive individual-level indicators) | HH |
| 5 | WGTPOP | Population weighting coefficient (weighting co-efficient to derive population-level indicators) | HH |
| 6 | IDH | Household unique identification | HH |
| 7 | IDP | Individual identification | HH |
| 8 | HHSIZE | Household members | HH |
| 9 | GENDER | Sex | IND |
| 10 | REL | Relationship to household head | IND |
| 11 | MARITAL | Marital status | IND |
| 12 | AGEYRS | Age in completed years | IND |
| 13 | AGEMTH | Age of child in completed months | IND |
| 14 | RELIG | Religion of household head | HH |
| 15 | ETHNICITY | Ethnicity | IND |
| 16 | LANGUAGE | Language | IND |
| 17 | MORBID | Morbidity last x weeks | IND |
| 18 | MEASLES | Child immunized against Measles | IND |
| 19 | MEDATT | Sought medical attention | IND |
| 20 | CHWEIGHTKG | Weight of the child (Kg) | IND |
| 21 | CHHEIGHTCM | Height of the child (cms) | IND |
| 22 | ATSCHOOL | Current school enrolment | IND |
| 23 | EDUCY | Highest level of education completed | IND |
| 24 | EDYRS | Years of education | IND |
| 25 | EDYRSCURRAT | Years of education for currently enrolled | IND |
| 26 | SCHTYP | Type of school attending | IND |
| 27 | LITERACY | Literacy status | IND |
| 28 | EMPTYP1 | Type of employment, Primary job | IND |
| 29 | UNEMP1 | Unemployed | IND |
| 30 | INDUSTRY1 | 1 digit industry classification, Primary job | IND |
| 31 | EMPCAT1 | Employment categories, Primary job | IND |
| 32 | WHOURSWEEK1 | Hours worked last week, Primary job | IND |
| 33 | OWNHOUSE | Ownership of dwelling unit | HH |
| 34 | ROOF | Main material used for roof | HH |
| 35 | TOILET | Main toilet facility | HH |
| 36 | ELECTCON | Connection of electricity in dwelling | HH |
| 37 | FUELCOOK | Main cooking fuel | HH |
| 38 | WATER | Main source of water | HH |
| 39 | OWNAGLAND | Ownership of agricultural land | HH |
| 40 | LANDSIZEHA | Land size owned by household (ha) | HH |
| 41 | OWNMOTORCYCLE | Ownership of motorcycle | HH |
| 42 | CAR | Ownership of car | HH |
| 43 | TV | Ownership of television | HH |
| 44 | LIVESTOCK | Number of large-sized livestock owned | HH |
| 45 | INCRMT | Total amount of remittances received from remittance sending members | HH |
| 46 | INCWAGE | Wage and salaries (annual) | HH |
| 47 | INCBONSOCALL | Bonus and social allowance from wage job (annual) | HH |
| 48 | INCFARMBSN | Gross income from household farm businesses (annual) | HH |
| 49 | INCNFARMBSN | Gross income from household non-farm businesses (annual) | HH |
| 50 | INCRENT | Rental income (annual) | HH |
| 51 | INCFIN | Financial income from savings, loans, tax refunds, maturity payments on insurance | HH |
| 52 | INCPENSN | Pension and other social assistance (annual) | HH |
| 53 | INCOTHER | Other income(annual) | HH |
| 54 | INCTOTGROSSHH | Total gross household income (annual) | HH |
| 55 | FARMEMP | Farm employment | HH |
| 56 | THOUSEXP | Total expenditure on housing | HH |
| 57 | TFOODEXP | Total food expenditure | HH |
| 58 | TALCHEXP | Total alcohol expenditure | HH |
| 59 | TCLTHEXP | Total expenditure on clothing and footwear | HH |
| 60 | TFURNEXP | Total expenditure on furnishing | HH |
| 61 | THLTHEXP | Total expenditure on health | HH |
| 62 | TTRANSEXP | Total expenditure on transport | HH |
| 63 | TCOMMEXP | Total expenditure on communications | HH |
| 64 | TRECEXP | Total expenditure on recreation | HH |
| 65 | TEDUEXP | Total expenditure on education | HH |
| 66 | TRESTHOTEXP | Total expenditure on restaurants and hotel | HH |
| 67 | TMISCEXP | Total miscellaneous expenditure | HH |
| 68 | TANHHEXP | Total annual nominal household expenditures | HH |
Appendix B: Example of Blanket Agreement for SUF
Agreement between [providing agency] and [receiving agency] regarding the deposit and use of microdata
A. This agreement relates to the following microdatasets:
- _______________________________________________________
- _______________________________________________________
- _______________________________________________________
- _______________________________________________________
- _______________________________________________________
- Terms of the agreement:
As the owner of the copyright in the materials listed in section A, or as duly authorized by the owner of the copyright in the materials, the representative of [providing agency] grants the [receiving agency] permission for the datasets listed in section A to be used by [receiving agency] employees, subject to the following conditions:
- Microdata (including subsets of the datasets) and copyrighted materials provided by the [providing agency] will not be redistributed or sold to other individuals, institutions or organisations without the [providing agency]’s written agreement. Non-copyrighted materials which do not contain microdata (such as survey questionnaires, manuals, codebooks, or data dictionaries) may be distributed without further authorization. The ownership of all materials provided by the [providing agency] remains with the [providing agency].
- Data will be used for statistical and scientific research purposes only. They will be employed solely for reporting aggregated information, including modeling, and not for investigating specific individuals or organisations.
- No attempt will be made to re-identify respondents, and there will be no use of the identity of any person or establishment discovered inadvertently. Any such discovery will be reported immediately to the [providing agency].
- No attempt will be made to produce links between datasets provided by the [providing agency] or between [providing agency] data and other datasets that could identify individuals or organisations.
- Any books, articles, conference papers, theses, dissertations, reports or other publications employing data obtained from the [providing agency] will cite the source, in line with the citation requirement provided with the dataset.
- An electronic copy of all publications based on the requested data will be sent to the [providing agency].
- The [providing agency] and the relevant funding agencies bear no responsibility the data’s use or for interpretation or inferences based upon it.
- An electronic copy of all publications based on the requested data will be sent to the [providing agency].
- Data will be stored in a secure environment, with adequate access restrictions. The [providing agency] may at any time request information on the storage and dissemination facilities in place.
- The [recipient agency] will provide an annual report on uses and users of the listed microdatasets to the [providing agency], with information on the number of researchers having accessed each dataset, and on the output of this research.
- This access is granted for a period of [provide information on this period, or state that the agreement is open ended].
- Communications:
The [receiving organisation] will appoint a contact person who
will act as unique focal person for this agreement. Should the focal person be replaced, the [recipient agency] will immediately communicate the name and coordinates of the new contact person to the [providing agency]. Communications for administrative and procedural purposes may be made by email, fax or letter as follows:
Communications made by [providing agency] to [recipient agency] will be directed to:
Name of contact person:
Title of contact person:
Address of the recipient agency:
Email:
Tel:
Fax:
Communications made by [recipient agency] to [depositor agency]
will be directed to:
Name of contact person:
Title of contact person:
Address of the recipient agency:
Email:
Tel:
Fax:
D. Signatories
The following signatories have read and agree with the Agreement as presented above:
Representative of the [providing agency]
Name ____________________________________________________
Signature _______________________________ Date ______________
Representative of the [recipient agency]
Name ____________________________________________________
Signature _______________________________ Date ______________
Source: DuBo10
Appendix C: Internal and External Reports for Case Studies
This appendix provides example of internal and external reports on the anonymization process for the case studies in Section 9.1. The internal report consists of two parts: the first is for the anonymization of the household-level variables and the second is for the anonymization of the individual-level variables.
Case study 1 - Internal report
SDC report (adapted from the report function in sdcMicro)
The dataset consists of 10,574 observations (i.e., 10,574 individuals in 2,000 households).
Household-level variables
Anonymization methods applied to household-level variables:
- Removing households of size larger than 13 (29 households)
- Local suppression to achieve 2-anonymity, with importance vector to prevent suppressing values of the variables HHSIZE, REGION and URBRUR
- Recoding the variable LANDSIZEHA: rounding to one digit for values smaller than 1, rounding to zero digits for other values, grouping values 5-19 and 20-40, topcoding at 40
- PRAMming the variables ROOF, TOILET, WATER, ELECTCON, FUELCOOK, OWNMOTORCYCLE, CAR, TV and LIVESTOCK
- Noise addition (level 0.01 and 0.05 for outliers) to the income and expenditure components, replacing aggregates by sum of perturbed components
Selected (key) variables:
- Modifications on categorical key variables: TRUE
- Modifications on continuous key variables: TRUE
- Modifications using PRAM: TRUE
- Local suppressions: TRUE
Disclosure risk (household-level variables):
Frequency analysis for categorical key variables:
Number of observations violating
2-Anonymity: 0 (unmodified data: 103)
3-Anonymity: 104 (unmodified data: 229)
5-Anonymity: 374 (unmodified data: 489)
Percentage of observations violating
2-Anonymity: 0% (unmodified data: 5.15%)
3-Anonymity: 5.28% (unmodified data: 11.45%)
5-Anonymity: 18.7% (unmodified data: 24.45%)
Disclosure risk categorical variables:
Expected Percentage of Re-identifications: 0.05161614% (~ 1.0 observations)
(unmodified data: 0.001820465% (~ 0.36 observations))
10 combinations of categories with highest risk:
| URBRUR | REGION | HHSIZE | OWNAGLAND | RELIG | fk | Fk | |
|---|---|---|---|---|---|---|---|
| 1 | 2 | 6 | 2 | 3 | 7 | 1 | 372.37 |
| 2 | 1 | 5 | 1 | 1 | 6 | 1 | 226.35 |
| 3 | 2 | 5 | 2 | 3 | 6 | 1 | 430.21 |
| 4 | 2 | 2 | 1 | 1 | NA | 1 | 173.05 |
| 5 | 2 | 6 | 1 | 1 | 5 | 1 | 80.05 |
| 6 | 1 | 6 | 1 | 3 | 5 | 1 | 343.27 |
| 7 | 2 | 5 | 1 | 2 | NA | 1 | 140.60 |
| 8 | 2 | 6 | 1 | 3 | 7 | 1 | 230.29 |
| 9 | 2 | 5 | 12 | 1 | 9 | 1 | 475.01 |
| 10 | 2 | 6 | 3 | 1 | 1 | 1 | 338.57 |
Disclosure risk continuous scaled variables:
Distance-based Disclosure Risk for Continuous Key Variables:
Disclosure Risk is between 0% and 100% in the modified data. In the original data, the risk is approximately 100%.
Data Utility (household-level variables):
29 households have been removed due to their household sizes
Frequencies categorical key variables
URBRUR
| categories1 | 1 | 2 | NA |
|---|---|---|---|
| orig | 1316 | 684 | 0 |
| categories2 | 1 | 2 | NA |
| recoded | 1299 | 666 | 6 |
REGION
| categories1 | 1 | 2 | 3 | 4 | 5 | 6 | NA |
|---|---|---|---|---|---|---|---|
| orig | 324 | 334 | 371 | 375 | 260 | 336 | 0 |
| categories2 | 1 | 2 | 3 | 4 | 5 | 6 | NA |
| recoded | 315 | 328 | 370 | 370 | 257 | 330 | 1 |
HHSIZE
| categories1 | 1 | 2 | 3 | 4 | 5 | 6 | 7 | 8 | 9 | 10 | 11 | 12 |
|---|---|---|---|---|---|---|---|---|---|---|---|---|
| orig | 152 | 194 | 238 | 295 | 276 | 252 | 214 | 134 | 84 | 66 | 34 | 21 |
| categories1 | 13 | 14 | 15 | 16 | 17 | 18 | 19 | 20 | 21 | 22 | 33 | |
| orig | 11 | 6 | 6 | 5 | 4 | 2 | 1 | 2 | 1 | 1 | 1 | |
| categories2 | 1 | 2 | 3 | 4 | 5 | 6 | 7 | 8 | 9 | 10 | 11 | 12 |
| recoded | 152 | 194 | 238 | 295 | 276 | 252 | 214 | 134 | 84 | 66 | 34 | 21 |
| categories2 | 13 | |||||||||||
| recoded | 10 |
OWNAGLAND
| categories1 | 1 | 2 | 3 | NA |
|---|---|---|---|---|
| orig | 763 | 500 | 332 | 405 |
| categories2 | 1 | 2 | 3 | NA |
| recoded | 735 | 482 | 310 | 444 |
RELIG
| categories1 | 1 | 5 | 6 | 7 | 9 | NA |
|---|---|---|---|---|---|---|
| orig | 179 | 383 | 267 | 7 | 154 | 1010 |
| categories2 | 1 | 5 | 6 | 7 | 9 | NA |
| recoded | 175 | 380 | 260 | 5 | 148 | 1003 |
Local suppressions
Number of local suppressions:
| URBRUR | REGION | HHSIZE | OWNAGLAND | RELIG | |
|---|---|---|---|---|---|
| absolute | 6 | 1 | 1 | 48 | 16 |
| relative (in percent) | 0.304% | 0.051% | 0.051% | 2.435% | 0.812% |
Data utility of continuous scaled key variables:
Univariate summary:
| Min. | 1st Qu | Median | Mean | 3rd Qu | Max. | |
|---|---|---|---|---|---|---|
| TANHHEX P | 0 | 0,2 | 1 | 6,689 | 2,421 | 1214 |
| TANHHEX P.m | 0 | 0,2 | 1 | 3,427 | 2 | 40 |
| TFOODEX P | 498 | 15170 | 17090 | 24340 | 23260 | 353200 |
| TFOODEX P.m | 127,1 | 15100 | 17060 | 23410 | 22110 | 275300 |
| TALCHEX P | 0 | 8438 | 11890 | 12920 | 13070 | 127900 |
| TALCHEX P.m | -209,7 | 8377 | 11880 | 12570 | 13030 | 124800 |
| TCLTHEX P | 0 | 0 | 0 | 401,7 | 0 | 85280 |
| TCLTHEX P.m | -77,53 | -13,59 | 6,42 | 404,7 | 30,69 | 85280 |
| THOUSEX P | 0 | 121 | 131 | 733,8 | 672,8 | 28400 |
| THOUSEX P.m | -54,65 | 111,4 | 138,8 | 706,1 | 618,9 | 28410 |
| TFURNEX P | 0 | 1211 | 1340 | 2233 | 1970 | 197500 |
| TFURNEX P.m | -39,54 | 1198 | 1340 | 2066 | 1933 | 49230 |
| THLTHEX P | 0 | 153,8 | 167 | 479,8 | 302 | 17780 |
| THLTHEX P.m | -18,79 | 146,8 | 168,6 | 453,1 | 295,2 | 15720 |
| TTRANSE XP | 0 | 1 | 634 | 961 | 687 | 49650 |
| TTANSEX P.m | -80,58 | 26,66 | 627,1 | 917,2 | 692,4 | 49640 |
| TCOMMEX P | 0 | 146 | 241 | 1158 | 434 | 91920 |
| TCOMMEX P.m | -115,2 | 139,1 | 238,3 | 1104 | 403,2 | 91920 |
| TRECEXP | 0 | 3 | 95 | 577,2 | 107 | 34000 |
| TRECEXP .m | -61,27 | 21,35 | 92,28 | 555,4 | 128,8 | 33960 |
| TEDUEXP | 0 | 0 | 0 | 123,7 | 0 | 15880 |
| TEDUEXP .m | -29,23 | -5,06 | 1,213 | 121,8 | 9,748 | 15860 |
| TRESHOT EXP | 0 | 154 | 722 | 2730 | 784 | 240300 |
| TRESHOT EXP.m | -396,1 | 190,5 | 671,6 | 2568 | 872 | 240400 |
| TMISCEX P | 0 | 0 | 467 | 875,1 | 528 | 63700 |
| TMISCEX P.m | -93,39 | 0,7588 | 442,7 | 860,7 | 531,9 | 63680 |
| INCTOTG ROSSHH | 0 | 444 | 1041 | 1148 | 1126 | 67420 |
| INCTOTG ROSSHH. m | -24,92 | 446 | 1041 | 1087 | 1124 | 14940 |
| INCRMT | 5000 | 12400 | 13390 | 30840 | 24200 | 683900 |
| INCRMT. m | 4069 | 9071 | 17000 | 33040 | 36680 | 570000 |
| INCWAGE | 0 | 0 | 0 | 1276 | 0 | 300000 |
| INCWAGE .m | -295,1 | -46,95 | 20,93 | 1261 | 114,4 | 300100 |
| INCFARM BSN | 0 | 9262 | 12950 | 23460 | 14570 | 683900 |
| INCFARM BSN.m | -1466 | 9336 | 12980 | 23420 | 14750 | 684000 |
| INCNFAR MBSN | 0 | 0 | 0 | 3809 | 3900 | 165400 |
| INCNFAR MBSN.m | -232,4 | -10,69 | 142,6 | 3415 | 3846 | 160100 |
| INCRENT | 0 | 0 | 827,5 | 9166 | 7307 | 400000 |
| INCRENT .m | -757,4 | 43,89 | 783,7 | 8637 | 7267 | 394800 |
| INCFIN | 0 | 0 | 0 | 1783 | 0 | 120000 |
| INCFIN. m | -248,5 | -56,57 | 11,54 | 1608 | 90,27 | 120000 |
| INCPENS N | 0 | 0 | 0 | 74,58 | 0 | 14400 |
| INCPENS N.m | -20,2 | -4,591 | 0,1964 | 76,62 | 5,796 | 14380 |
| INCOTHE R | 0 | 0 | 0 | 331,3 | 0 | 60000 |
| INCOTHE R.m | -123,3 | -24,78 | -0,0261 7 | 331,1 | 26,75 | 60050 |
| LANDSIZ EHA | 0 | 0 | 0 | 549,1 | 0 | 82300 |
| LANDSIZ EHA.m | -126,2 | -21,91 | 3,4 | 486,7 | 30,88 | 79670 |
Information loss:
Criteria IL1: 0.01219892
Individual-level variables
- Modifications on categorical key variables: TRUE
- Modifications on continuous key variables: FALSE
- Modifications using PRAM: FALSE
- Local suppressions: TRUE
Disclosure risk (individual-level variables):
Anonymization methods applied to individual-level variables:
- Recoding AGEYRS from months to years for age under 1, and to ten-year intervals for age values between 15 and 65, topcoding age at 65
- Local suppression to achieve 2-anonymity
Frequency analysis for categorical key variables:
Number of observations violating
2-Anonymity: 0 (unmodified data: 998)
3-Anonymity: 0 (unmodified data: 1384)
5-Anonymity: 935 (unmodified data: 2194)
Percentage of observations violating
2-Anonymity: 0% (unmodified data: 9.91%)
3-Anonymity: 0% (unmodified data: 13.75%)
5-Anonymity: 6.23% (unmodified data: 21.79%)
Disclosure risk categorical variables:
Expected Percentage of Reidentifications: 0.02% (~ 2.66 observations)
(unmodified data: 0.24% (~23.98 observations))
Expected Percentage of Reidentifications (hierarchical risk): 0.1% (~ 15.34 observations)
(unmodified data: 1.26 % (~ 127.12 observations))
10 combinations of categories with highest risk:
| GENDER | REL | MARITAL | AGEYRS | EDUCY | EDYRSATCURRAT | ATSCHOOL | INDUSTRY1 | fk | Fk | |
|---|---|---|---|---|---|---|---|---|---|---|
| 1 | 1 | 1 | 3 | 38 | 6 | NA | 0 | 9 | 1 | 73. 31 |
| 2 | 1 | 1 | 3 | 20 | 1 | NA | 0 | 6 | 1 | 69. 53 |
| 3 | 1 | 1 | 2 | 39 | 2 | NA | 0 | 5 | 1 | 54. 63 |
| 4 | 1 | 1 | 1 | 36 | 6 | NA | 0 | 9 | 1 | 73. 31 |
| 5 | 1 | 1 | 3 | 42 | 2 | NA | 0 | 1 | 1 | 39. 58 |
| 6 | 0 | 1 | 6 | 74 | 1 | NA | 0 | 1 | 1 | 58. 12 |
| 7 | 0 | 1 | 6 | 34 | 2 | NA | 0 | 1 | 1 | 57. 40 |
| 8 | 1 | 1 | 1 | 26 | 4 | NA | 0 | 5 | 1 | 66. 21 |
| 9 | 1 | 1 | 4 | 35 | 1 | NA | 0 | 10 | 1 | 57. 13 |
| 10 | 1 | 6 | 1 | 12 | 1 | NA | 0 | 5 | 1 | 57. 13 |
Data utility (individual-level variables):
Frequencies categorical key variables
GENDER
| categories1 | 0 | 1 | NA |
|---|---|---|---|
| orig | 5197 | 4871 | 0 |
| categories2 | 0 | 1 | NA |
| recoded | 5197 | 4871 | 0 |
REL
| categories1 | 1 | 2 | 3 | 4 | 5 | 6 | 7 | 8 | 9 | NA |
|---|---|---|---|---|---|---|---|---|---|---|
| orig | 1970 | 1319 | 4933 | 57 | 765 | 89 | 817 | 51 | 63 | 4 |
| categories2 | 1 | 2 | 3 | 4 | 5 | 6 | 7 | 8 | 9 | NA |
| recoded | 1698 | 1319 | 4933 | 52 | 765 | 54 | 817 | 40 | 63 | 327 |
MARITAL
| categories1 | 1 | 2 | 3 | 4 | 5 | 6 | NA |
|---|---|---|---|---|---|---|---|
| orig | 3542 | 2141 | 415 | 295 | 330 | 329 | 3016 |
| categories2 | 1 | 2 | 3 | 4 | 5 | 6 | NA |
| recoded | 3542 | 2141 | 415 | 295 | 330 | 329 | 3016 |
AGEYRS
| categories1 | 0 | 1/12 | 2/12 | 3/12 | 4/12 | 5/12 | 6/12 | 7/12 | 8/12 | 9/12 |
|---|---|---|---|---|---|---|---|---|---|---|
| orig | 178 | 8 | 1 | 14 | 15 | 19 | 17 | 21 | 18 | 7 |
| categories1 | 10/12 | 11/12 | 1 | 2 | 3 | 4 | 5 | 6 | 7 | 8 |
| orig | 5 | 8 | 367 | 340 | 332 | 260 | 334 | 344 | 297 | 344 |
| categories1 | 9 | 10 | 11 | 12 | 13 | 14 | 15 | 16 | 17 | 18 |
| orig | 281 | 336 | 297 | 326 | 299 | 263 | 243 | 231 | 196 | 224 |
| categories1 | 19 | 20 | 21 | 22 | 23 | 24 | 25 | 26 | 27 | 28 |
| orig | 202 | 182 | 136 | 146 | 150 | 137 | 128 | 139 | 117 | 152 |
| categories1 | 29 | 30 | 31 | 32 | 33 | 34 | 35 | 36 | 37 | 38 |
| orig | 111 | 143 | 96 | 123 | 104 | 107 | 148 | 91 | 109 | 87 |
| categories1 | 39 | 40 | 41 | 42 | 43 | 44 | 45 | 46 | 47 | 48 |
| orig | 89 | 93 | 58 | 78 | 72 | 64 | 84 | 74 | 48 | 60 |
| categories1 | 49 | 50 | 51 | 52 | 53 | 54 | 55 | 56 | 57 | 58 |
| orig | 58 | 66 | 50 | 55 | 29 | 30 | 34 | 38 | 33 | 44 |
| categories1 | 59 | 60 | 61 | 62 | 63 | 64 | 65 | 66 | 67 | 68 |
| orig | 35 | 36 | 25 | 33 | 21 | 15 | 30 | 18 | 13 | 29 |
| categories1 | 69 | 70 | 71 | 72 | 73 | 74 | 75 | 76 | 77 | 78 |
| orig | 26 | 36 | 17 | 16 | 12 | 3 | 16 | 10 | 8 | 18 |
| categories1 | 79 | 80 | 81 | 82 | 83 | 84 | 85 | 86 | 87 | 88 |
| orig | 11 | 13 | 5 | 2 | 7 | 7 | 7 | 3 | 2 | 2 |
| categories1 | 89 | 90 | 91 | 92 | 93 | 95 | NA | |||
| orig | 4 | 4 | 3 | 1 | 1 | 1 | 188 | |||
| categories2 | 0 | 1 | 2 | 3 | 4 | 5 | 6 | 7 | 8 | 9 |
| recoded | 311 | 367 | 340 | 332 | 260 | 334 | 344 | 297 | 344 | 281 |
| categories2 | 10 | 11 | 12 | 13 | 14 | 20 | 30 | 40 | 50 | 60 |
| recoded | 336 | 297 | 326 | 299 | 263 | 1847 | 1220 | 889 | 554 | 314 |
| categories2 | 65 | NA | ||||||||
| recoded | 325 | 188 |
EDUCY
| categories1 | 0 | 1 | 2 | 3 | 4 | 5 | 6 | NA |
|---|---|---|---|---|---|---|---|---|
| orig | 1582 | 4755 | 1062 | 330 | 139 | 46 | 104 | 2050 |
| categories2 | 0 | 1 | 2 | 3 | 4 | 5 | 6 | NA |
| recoded | 1582 | 4755 | 1062 | 330 | 139 | 46 | 104 | 2050 |
EDYRSATCURR
| categories1 | 0 | 1 | 2 | 3 | 4 | 5 | 6 | 7 | 8 | 9 |
|---|---|---|---|---|---|---|---|---|---|---|
| orig | 177 | 482 | 445 | 446 | 354 | 352 | 289 | 266 | 132 | 127 |
| categories1 | 10 | 11 | 12 | 13 | 15 | 16 | 18 | NA | ||
| orig | 143 | 58 | 46 | 27 | 18 | 10 | 54 | 6642 | ||
| categories2 | 0 | 1 | 2 | 3 | 4 | 5 | 6 | 7 | 8 | 9 |
| recode | 177 | 482 | 445 | 446 | 354 | 352 | 289 | 266 | 132 | 127 |
| categories2 | 10 | 11 | 12 | 13 | 15 | 16 | 18 | NA | ||
| recode | 143 | 58 | 46 | 27 | 18 | 10 | 54 | 6642 |
ATSCHOOL
| categories1 | 0 | 1 | NA |
|---|---|---|---|
| orig | 4696 | 3427 | 1945 |
| categories2 | 0 | 1 | NA |
| recoded | 4696 | 3427 | 1945 |
INDUSTRY1
| categories1 | 1 | 2 | 3 | 4 | 5 | 6 | 7 | 8 | 9 | 10 | NA |
|---|---|---|---|---|---|---|---|---|---|---|---|
| orig | 5300 | 16 | 153 | 2 | 93 | 484 | 95 | 17 | 70 | 292 | 3546 |
| categories2 | 1 | 2 | 3 | 4 | 5 | 6 | 7 | 8 | 9 | 10 | NA |
| recoded | 5300 | 16 | 153 | 2 | 93 | 484 | 95 | 17 | 70 | 292 | 3546 |
Local suppressions
Number of local suppressions:
| GENDER | REL | MARITAL | AGEYRS | EDUCY | |
|---|---|---|---|---|---|
| absolute | 0 | 323 | 0 | 0 | 0 |
| relative (in percent) | 0 | 3.21% | 0 | 0 | 0 |
| EDYRSATCURR | ATSCHOOL | INDUSTRY1 | |||
|---|---|---|---|---|---|
| absolute | 0 | 0 | 0 | ||
| relative (in percent) | 0 | 0 | 0 |
Case study 1 - External report
This case study microdata set has been treated to protect confidentiality. Several methods have been applied to protect the confidentiality: removing variables from the original dataset, removing records from the dataset, reducing detail in variables by recoding and top-coding, removing particular values of individuals at risk (local suppression) and perturbing values of certain variables.
Removing variables
The released microdata set has only a selected number of variables contained in the initial survey. Not all variables could be released in this SUF without breaching confidentiality rules.
Removing records
To protect confidentiality, records of households larger than 13 were removed. Thirty households out of a total of 2,000 households in the dataset were removed.
Reducing detail in variables by recoding and top-coding
The variable LANDSIZEHA was rounded to one digit for values smaller than 1, rounded to zero digits for other values, grouped for values 5-19 and 20-40 and topcoded at 40. The variable AGEYRS was recoded to ten-year age intervals for values in the age range 15 ΓÇô 65.
Local suppression
Values of certain variables for particular households and individuals were deleted. In total, six values of the variable URBRUR, one of the REGION variable, 48 for the OWNAGLAND variable, 16 for the RELIG variable and 323 values of the variable REL were deleted.
Perturbing values
Uncertainty was introduced in the variables ROOF, TOILET, WATER, ELECTCON, FUELCOOK, OWNMOTORCYCLE, CAR, TV and LIVESTOCK by using the PRAM method. This method changes a certain percentage of values of variables within each variable. Here invariant PRAM was used, which guarantees that the univariate tabulations stay unchanged. Multivariate tabulations may be changed. Unfortunately, the transition matrix cannot be published.
The income and expenditure variables were perturbed by adding noise (adding small random values to the original values). The noise added was 0.01 times the standard deviation in the original data and 0.05 for outliers. Noise was added to the components and the aggregates were recomputed to guarantee that the proportions of the different components did not change.
Case study 2 - Internal report
SDC report (adapted from the report function in sdcMicro)
This report describes the anonymization measures for the PUF release additional to those already taken in the first case study. Therefore, this report should be read in conjunction with the internal report for case study 1. The original dataset consists of 10,574 observations (i.e., 10,574 individuals in 2,000 households). The dataset used for the anonymization of the PUF file is the anonymized SUF file from case study 1. This dataset consists of 10.068 observations in 1,970 households. The difference is due to the removal of large households and sensitive or identifying variables in the first case study.
Household-level variables
Anonymization methods applied to household-level variables:
- For SUF release (see case study 1):
- Removing households of size larger than 13 (29 households)
- Local suppression to achieve 2-anonymity, with importance vector to prevent suppressing values of the variables HHSIZE, REGION and URBRUR
- For PUF release:
- Remove variables OWNLANDAG, RELIG and LANDSIZEHA
- Local suppression to achieve 5-anonymity, with importance vector to prevent suppressing values of the variables HHSIZE and REGION
- PRAMming the variables ROOF, TOILET, WATER, ELECTCON, FUELCOOK, OWNMOTORCYCLE, CAR, TV and LIVESTOCK
- Create deciles for aggregate income and expenditure (TANNEXP and INCTOTGROSSHH) and replace the actual values with the mean of the corresponding decile. Replace income and expenditure components with the proportion of original totals.
Selected (key) variables:
| categorical | URBRUR | REGION | HHSIZE |
|---|---|---|---|
| continuous | TANHHEXP | INCTOTGROSSHH | |
| weight | WGTPOP | ||
| hhID | not defined | ||
| strata | not defined |
- Modifications on categorical key variables: TRUE
- Modifications on continuous key variables: TRUE
- Modifications using PRAM: TRUE
- Local suppressions: TRUE
Disclosure risk (household-level variables):
Frequency analysis for categorical key variables:
Number of observations violating
2-Anonymity: 0 (PUF file: 0, unmodified data: 103)
3-Anonymity: 0 (PUF file: 18, unmodified data: 229)
5-Anonymity: 0 (PUF file: 92, unmodified data: 489)
Percentage of observations violating
2-Anonymity: 0.00% (PUF file: 0.00%, unmodified data: 5.15%)
3-Anonymity: 0.00% (PUF file: 0.91%, unmodified data: 11.45%)
5-Anonymity: 0.00% (PUF file: 4.67%, unmodified data: 24.45%)
Disclosure risk categorical variables:
Expected Percentage of Re-identifications: 0.0000526% (~ 0.10 observations),
PUF file: 0.0000642% (~ 0.13 observations), unmodified data: 0.001820465% (~ 0.36 observations)
11 combinations of categories with highest risk in PUF file:
| URBRUR | REGION | HHSIZE | fk | Fk | |
|---|---|---|---|---|---|
| 1 | 2 | 4 | 1 | 7 | 1152.084 |
| 2 | 2 | 4 | 1 | 7 | 1152.084 |
| 3 | 2 | 2 | 9 | 2 | 2356.926 |
| 4 | 2 | 4 | 1 | 7 | 1152.084 |
| 5 | 2 | 4 | 1 | 7 | 1152.084 |
| 6 | 2 | 4 | 1 | 7 | 1152.084 |
| 7 | 2 | 5 | 12 | 2 | 2978.454 |
| 8 | 2 | 4 | 1 | 7 | 1152.084 |
| 9 | 2 | 4 | 1 | 7 | 1152.084 |
| 10 | 2 | 5 | 12 | 2 | 2978.454 |
| 11 | 2 | 2 | 9 | 2 | 2356.926 |
Disclosure risk continuous scaled variables:
Distance-based Disclosure Risk for Continuous Key Variables:
Disclosure Risk is between 0% and 100% in the modified data. In the original data, the risk is approximately 100%.
Data Utility (household-level variables):
Frequencies categorical key variables
URBRUR
| categories1 | 1 | 2 | NA |
|---|---|---|---|
| orig | 1316 | 684 | 0 |
| categories2 | 1 | 2 | NA |
| recoded | 1280 | 623 | 67 |
REGION
| categories1 | 1 | 2 | 3 | 4 | 5 | 6 | NA |
|---|---|---|---|---|---|---|---|
| orig | 324 | 334 | 371 | 375 | 260 | 336 | 0 |
| categories2 | 1 | 2 | 3 | 4 | 5 | 6 | NA |
| recoded | 311 | 325 | 369 | 370 | 253 | 329 | 13 |
HHSIZE
| categories1 | 1 | 2 | 3 | 4 | 5 | 6 | 7 | 8 | 9 | 10 | 11 | 12 |
|---|---|---|---|---|---|---|---|---|---|---|---|---|
| orig | 152 | 194 | 238 | 295 | 276 | 252 | 214 | 134 | 84 | 66 | 34 | 21 |
| categories1 | 13 | 14 | 15 | 16 | 17 | 18 | 19 | 20 | 21 | 22 | 33 | |
| orig | 11 | 6 | 6 | 5 | 4 | 2 | 1 | 2 | 1 | 1 | 1 | |
| categories2 | 1 | 2 | 3 | 4 | 5 | 6 | 7 | 8 | 9 | 10 | 11 | 12 |
| recoded | 152 | 194 | 238 | 295 | 276 | 252 | 214 | 134 | 84 | 66 | 34 | 21 |
| categories2 | 13 | |||||||||||
| recoded | 10 |
Local suppressions
Number of local suppressions:
| URBRUR | REGION | HHSIZE | |
|---|---|---|---|
| absolute | 61 | 125 | 0 |
| relative (in percent) | 3.096% | 0.609% | 0.000% |
Data utility of continuous scaled key variables:
Univariate summary:
| Min. | 1st Qu | Median | Mean | 3rd Qu | Max. | |
|---|---|---|---|---|---|---|
| TANHHEX P | 498 | 15,170 | 17,090 | 24,340 | 23,260 | 353,230 |
| TANHHEX P.m | 827 | 14,700 | 17,060 | 23,420 | 22,750 | 83,963 |
| INCTOTG ROSSHH | 5,000 | 12,400 | 13,390 | 30,840 | 24,200 | 683,900 |
| INCTOTG ROSSHH. m | 6353 | 12,390 | 13,400 | 30,250 | 24,240 | 149,561 |
Information loss:
Criteria IL1: 0.2422625
Disclosure risk (individual-level variables):
Anonymization methods applied to individual-level variables:
- For SUF release (see case study 1):
- Recoding AGEYRS from months to years for age under 1, and to ten-year intervals for age values between 15 and 65, topcoding age at 65
- Local suppression to achieve 2-anonymity
- For PUF release:
- Remove variable EDYRSCURRAT
- Recode REL to ‘Head’, ‘Spouse’, ‘Child’, ‘Other relative’, ‘Other’
- Recode MARITAL to ‘Never married’, ‘Married/Living together’, ‘Divorced/Separated/Widowed’
- Recode AGEYRS for values under 15 to 7
- Recode EDUCY to ‘No education’, ‘Pre-school/ Primary not completed’, ‘Completed lower secondary or higher’
- Recode INDUSTRY1 to ‘Primary sector’, ‘Secondary sector’, ‘Tertiary sector’
Frequency analysis for categorical key variables:
Number of observations violating
2-Anonymity: 0 (PUF file: 0, unmodified data: 998)
3-Anonymity: 0 (PUF file: 167, unmodified data: 1384)
5-Anonymity: 0 (PUF file: 463, unmodified data: 2194)
Percentage of observations violating
2-Anonymity: 0.00% (PUF file: 0.00%, unmodified data: 9.91%)
3-Anonymity: 0.00% (PUF file: 1.66%, unmodified data: 13.75%)
5-Anonymity: 0.00% (PUF file: 4.60%, unmodified data: 21.79%)
Disclosure risk categorical variables:
Expected Percentage of Re-identifications: 0.00% (~0.41 observations)
(PUF file: 0.02 % (~ 1.69 observations), unmodified data: 0.24% (~23.98 observations))
Expected Percentage of Re-identifications (hierarchical risk): 0.02% (~2.29 observations)
(PUF file: 0.10 % (~ 9.57 observations), unmodified data: 1.26 % (~ 127.12 observations))
10 combinations of categories with highest risk:
| GEDNER | REL | MARIT AL | AGEYR S | EDUCY | INDUS TRY1 | fk | Fk | |
|---|---|---|---|---|---|---|---|---|
| 1 | 1 | 1 | 2 | 50 | 1 | 7 | 2 | 324.9 275 |
| 2 | 0 | 1 | 3 | 40 | 3 | 6 | 2 | 330.0 521 |
| 3 | 0 | 1 | 6 | 60 | 0 | 3 | 2 | 350.5 000 |
| 4 | 0 | 1 | 3 | 40 | 3 | 6 | 2 | 330.0 521 |
| 5 | 1 | 1 | 2 | 30 | 4 | 5 | 2 | 253.7 431 |
| 6 | 1 | 1 | 2 | 50 | 1 | 7 | 2 | 324.9 275 |
| 7 | 0 | 1 | 6 | 50 | 1 | 6 | 2 | 255.6 142 |
| 8 | 1 | 1 | 4 | 40 | 1 | 10 | 2 | 175.0 797 |
| 9 | 1 | 1 | 4 | 40 | 1 | 10 | 2 | 175.0 797 |
| 10 | 1 | 1 | 3 | 30 | 1 | 6 | 2 | 323.4 879 |
Data utility (individual-level variables):
Frequencies categorical key variables
GENDER
| categories1 | 0 | 1 | NA |
|---|---|---|---|
| orig | 5,197 | 4,871 | 0 |
| categories2 | 0 | 1 | NA |
| recoded | 5,197 | 4,871 | 0 |
REL
| categories1 | 1 | 2 | 3 | 4 | 5 | 6 | 7 | 8 | 9 | NA |
|---|---|---|---|---|---|---|---|---|---|---|
| orig | 1,970 | 1,319 | 4,933 | 57 | 765 | 89 | 817 | 51 | 63 | 4 |
| categories2 | 1 | 2 | 3 | 7 | 9 | NA | ||||
| recoded | 1,698 | 1,319 | 4,933 | 1,688 | 103 | 327 |
MARITAL
| categories1 | 1 | 2 | 3 | 4 | 5 | 6 | NA |
|---|---|---|---|---|---|---|---|
| orig | 3,542 | 2,141 | 415 | 295 | 330 | 329 | 3,016 |
| categories2 | 1 | 2 | 9 | NA | |||
| recoded | 3,542 | 2,851 | 659 | 3,016 |
AGEYRS
| categories1 | 0 | 1/12 | 2/12 | 3/12 | 4/12 | 5/12 | 6/12 | 7/12 | 8/12 | 9/12 |
|---|---|---|---|---|---|---|---|---|---|---|
| orig | 178 | 8 | 1 | 14 | 15 | 19 | 17 | 21 | 18 | 7 |
| categories1 | 10/12 | 11/12 | 1 | 2 | 3 | 4 | 5 | 6 | 7 | 8 |
| orig | 5 | 8 | 367 | 340 | 332 | 260 | 334 | 344 | 297 | 344 |
| categories1 | 9 | 10 | 11 | 12 | 13 | 14 | 15 | 16 | 17 | 18 |
| orig | 281 | 336 | 297 | 326 | 299 | 263 | 243 | 231 | 196 | 224 |
| categories1 | 19 | 20 | 21 | 22 | 23 | 24 | 25 | 26 | 27 | 28 |
| orig | 202 | 182 | 136 | 146 | 150 | 137 | 128 | 139 | 117 | 152 |
| categories1 | 29 | 30 | 31 | 32 | 33 | 34 | 35 | 36 | 37 | 38 |
| orig | 111 | 143 | 96 | 123 | 104 | 107 | 148 | 91 | 109 | 87 |
| categories1 | 39 | 40 | 41 | 42 | 43 | 44 | 45 | 46 | 47 | 48 |
| orig | 89 | 93 | 58 | 78 | 72 | 64 | 84 | 74 | 48 | 60 |
| categories1 | 49 | 50 | 51 | 52 | 53 | 54 | 55 | 56 | 57 | 58 |
| orig | 58 | 66 | 50 | 55 | 29 | 30 | 34 | 38 | 33 | 44 |
| categories1 | 59 | 60 | 61 | 62 | 63 | 64 | 65 | 66 | 67 | 68 |
| orig | 35 | 36 | 25 | 33 | 21 | 15 | 30 | 18 | 13 | 29 |
| categories1 | 69 | 70 | 71 | 72 | 73 | 74 | 75 | 76 | 77 | 78 |
| orig | 26 | 36 | 17 | 16 | 12 | 3 | 16 | 10 | 8 | 18 |
| categories1 | 79 | 80 | 81 | 82 | 83 | 84 | 85 | 86 | 87 | 88 |
| orig | 11 | 13 | 5 | 2 | 7 | 7 | 7 | 3 | 2 | 2 |
| categories1 | 89 | 90 | 91 | 92 | 93 | 95 | NA | |||
| orig | 4 | 4 | 3 | 1 | 1 | 1 | 188 | |||
| categories2 | 7 | 20 | 30 | 40 | 50 | 60 | 65 | NA | ||
| recoded | 4,731 | 1,847 | 1,220 | 889 | 554 | 314 | 325 | 188 |
EDUCY
| categories1 | 0 | 1 | 2 | 3 | 4 | 5 | 6 | NA |
|---|---|---|---|---|---|---|---|---|
| orig | 1582 | 4755 | 1062 | 330 | 139 | 46 | 104 | 2050 |
| categories2 | 0 | 1 | 2 | 3 | 4 | 5 | 6 | NA |
| recoded | 1,582 | 4,755 | 1,062 | 330 | 139 | 46 | 104 | 2,050 |
INDUSTRY1
| categories1 | 1 | 2 | 3 | 4 | 5 | 6 | 7 | 8 | 9 | 10 | NA |
|---|---|---|---|---|---|---|---|---|---|---|---|
| orig | 5,300 | 16 | 153 | 2 | 93 | 484 | 95 | 17 | 70 | 292 | 3,546 |
| categories2 | 1 | 2 | 3 | NA | |||||||
| recoded | 5,316 | 248 | 958 | 3,546 |
Local suppressions
Number of local suppressions:
| GENDER | REL | MARITAL | AGEYRS | EDUCY | INDUSTRY1 | |
|---|---|---|---|---|---|---|
| absolut e | 0 | 0 | 0 | 91 | 0 | 0 |
| relativ e (in percent ) | 0.00% | 0.00% | 0.00% | 0.90% | 0.00% | 0.00% |
Case study 2- External report
This case study microdata set has been treated to protect confidentiality. Several methods have been applied to protect the confidentiality: removing variables from the original dataset, removing records from the dataset, reducing detail in variables by recoding and top-coding, removing particular values of individuals at risk (local suppression) and perturbing values of certain variables.
Removing variables
The released microdata set has only a selected number of variables contained in the initial survey. Not all variables could be released in this PUF without breaching confidentiality rules.
Removing records
To protect confidentiality, records of households larger than 13 were removed. Twenty-nine households out of a total of 2,000 households in the dataset were removed.
Reducing detail in variables by recoding and top-coding
The variable AGEYRS was recoded to ten-year age intervals for values in the age range 15 ΓÇô 65 and bottom- and top-coded at 15 and 65. The variables REL, MARITAL, EDUCY and INDUSTRY1 were recoded to less detailed categories. The total income and expenditure variables were recoded to the mean of the corresponding deciles and the income and expenditure components to the proportion of the totals.
Local suppression
Values of certain variables for particular households and individuals were deleted. In total, 67 values of the variable URBRUR, 126 of the REGION variable, 91 for the AGEYRS variable and 323 values of the variable REL were deleted.
Perturbing values
Uncertainty was introduced in the variables ROOF, TOILET, WATER, ELECTCON, FUELCOOK, OWNMOTORCYCLE, CAR, TV and LIVESTOCK by using the PRAM method. This method changes a certain percentage of values of variables within each variable. Here invariant PRAM was used, which guarantees that the univariate tabulations stay unchanged. Multivariate tabulations may be changed. Unfortunately, the transition matrix cannot be published.
Appendix D: Execution Times for Multiple Scenarios Tested using Selected Sample Data
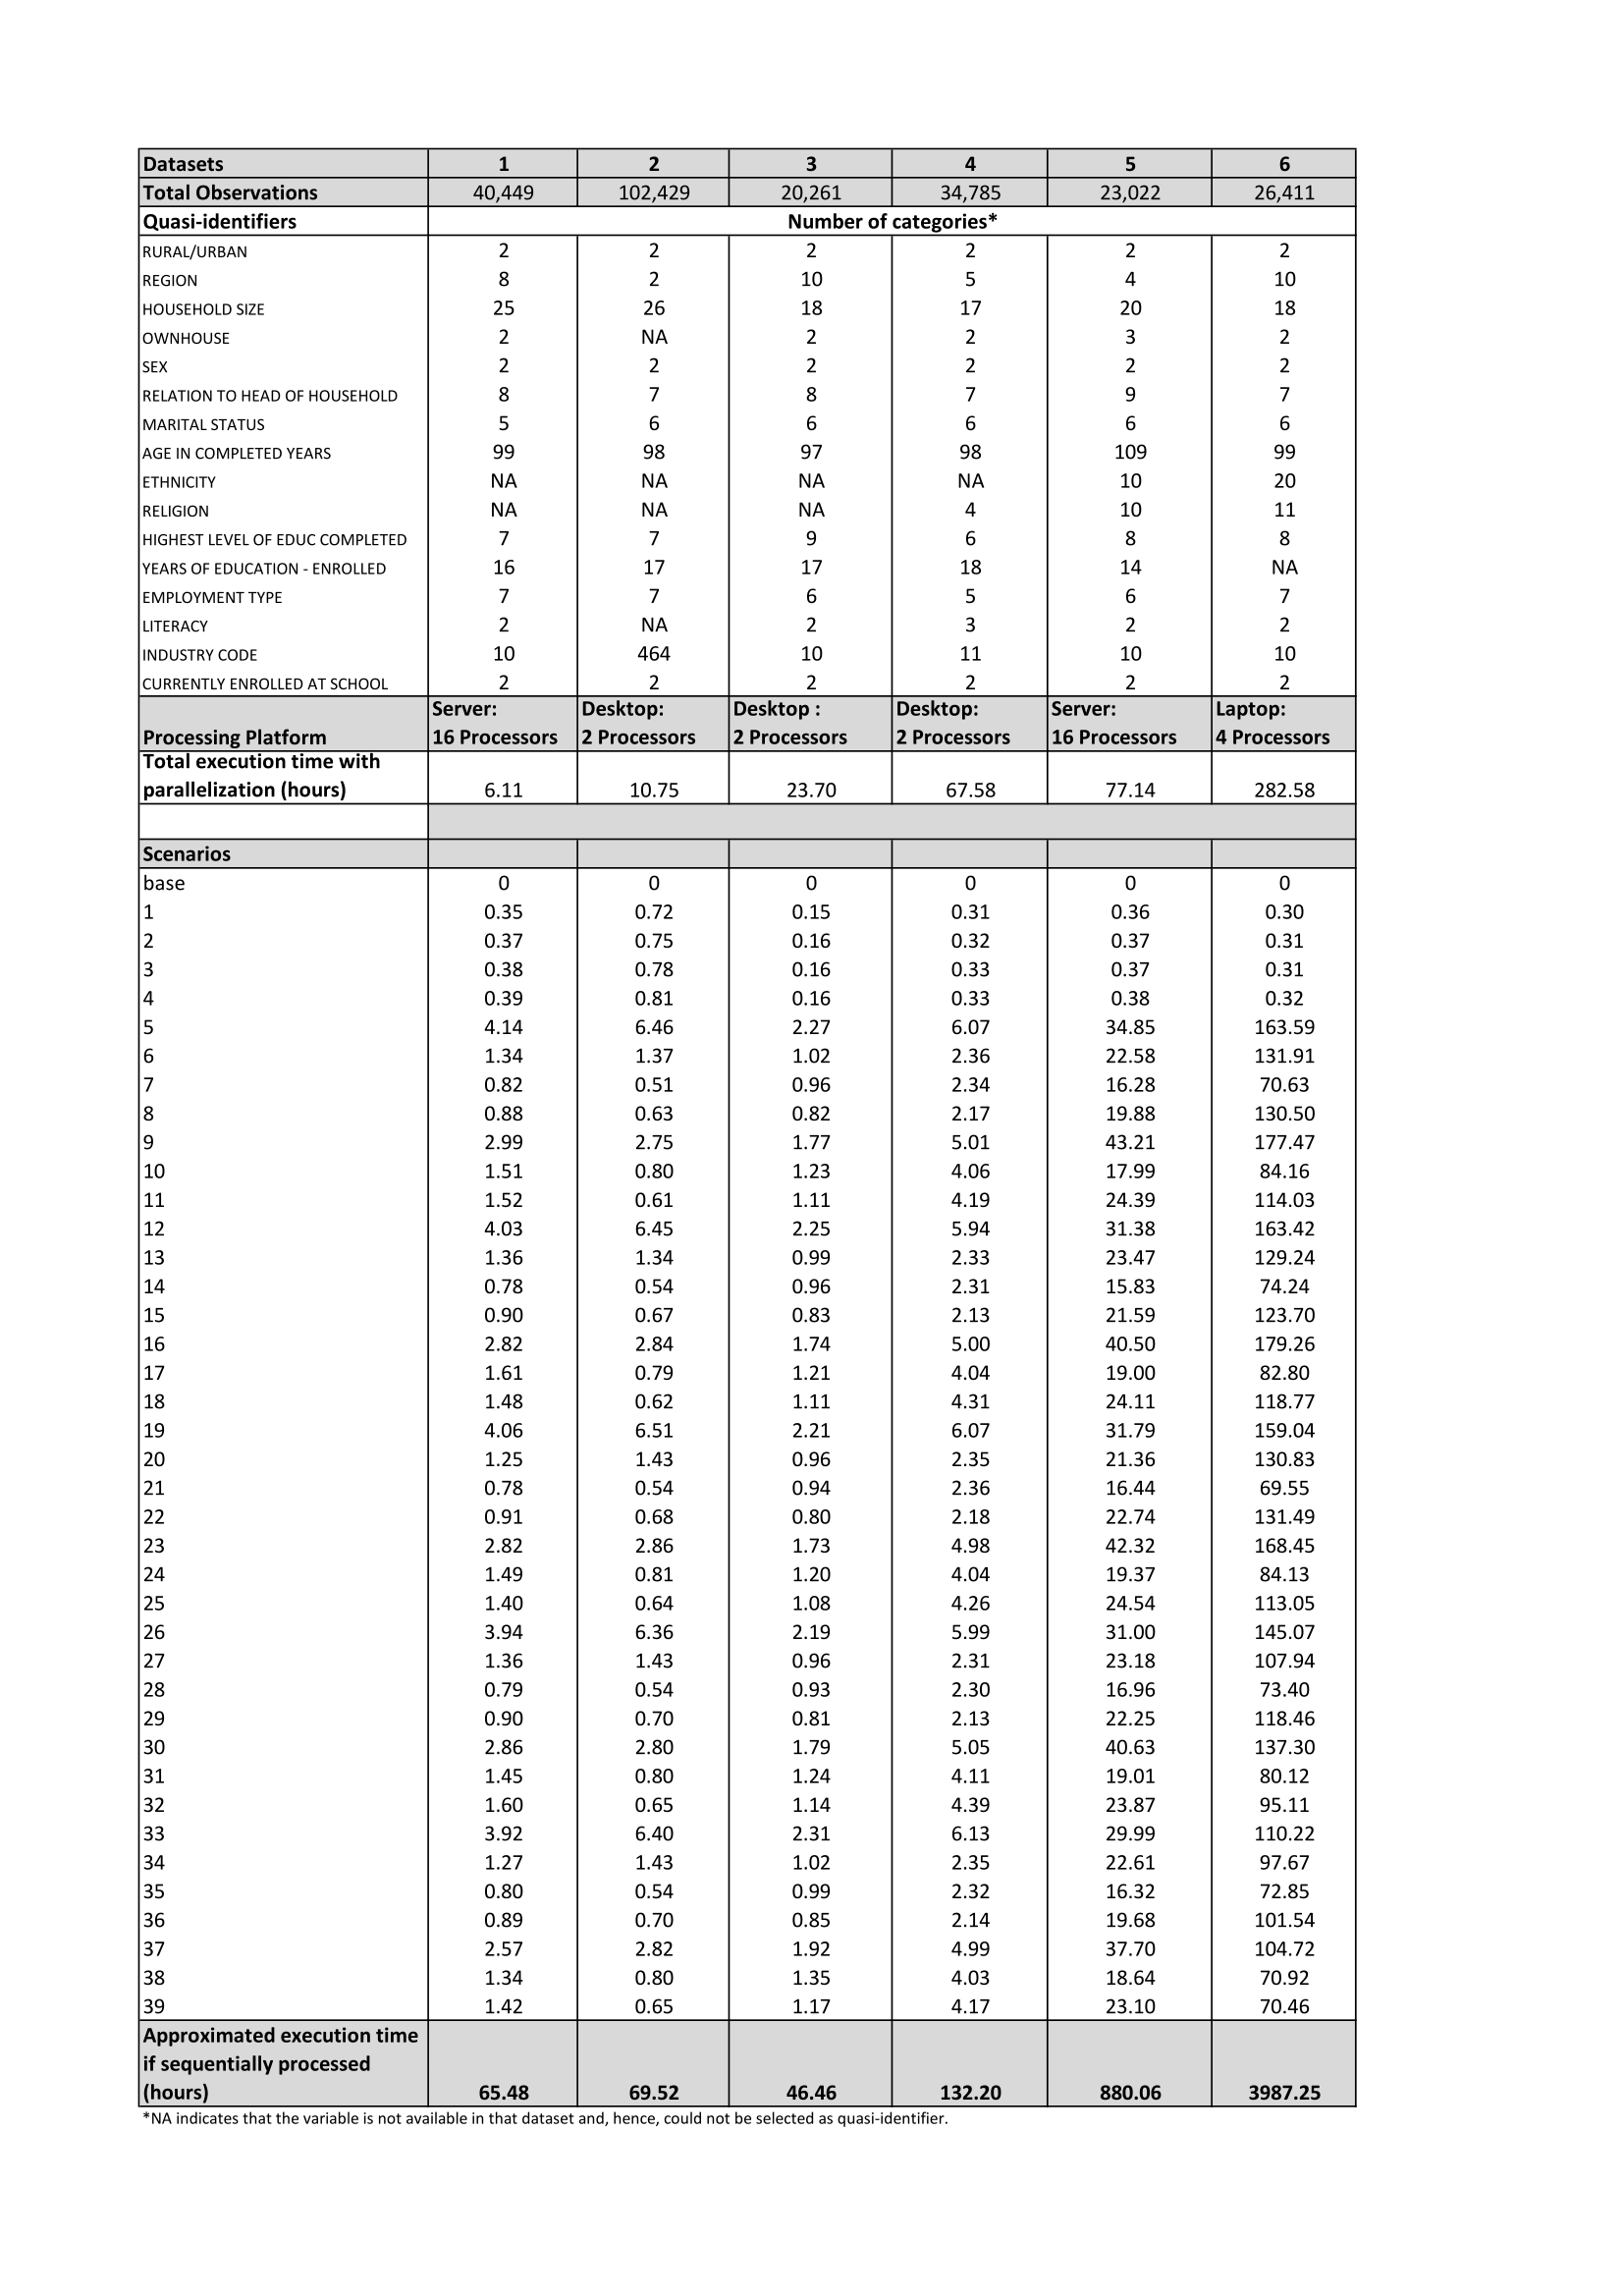
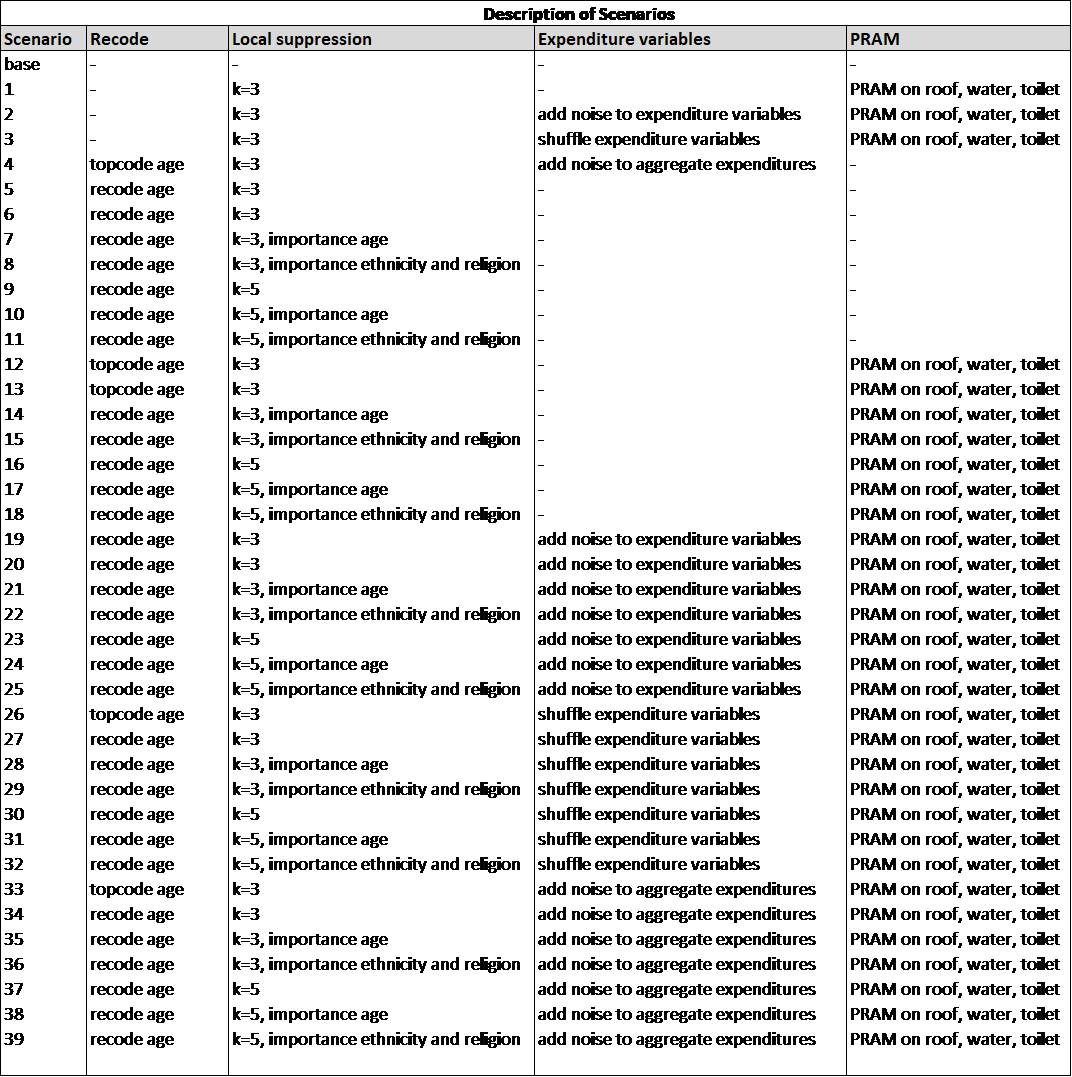
Fig. 24 Description of anonymization scenarios
References
| [DuBo10] | Dupriez, O., & Boyko, E. (2010). Dissemination of Microdata Files; Principles, Procedures and Practices. International Household Survey Network (IHSN). |